See your memory.
Understand your Mac.
Total memory per appMemory trends over timeKnow how much RAM you need
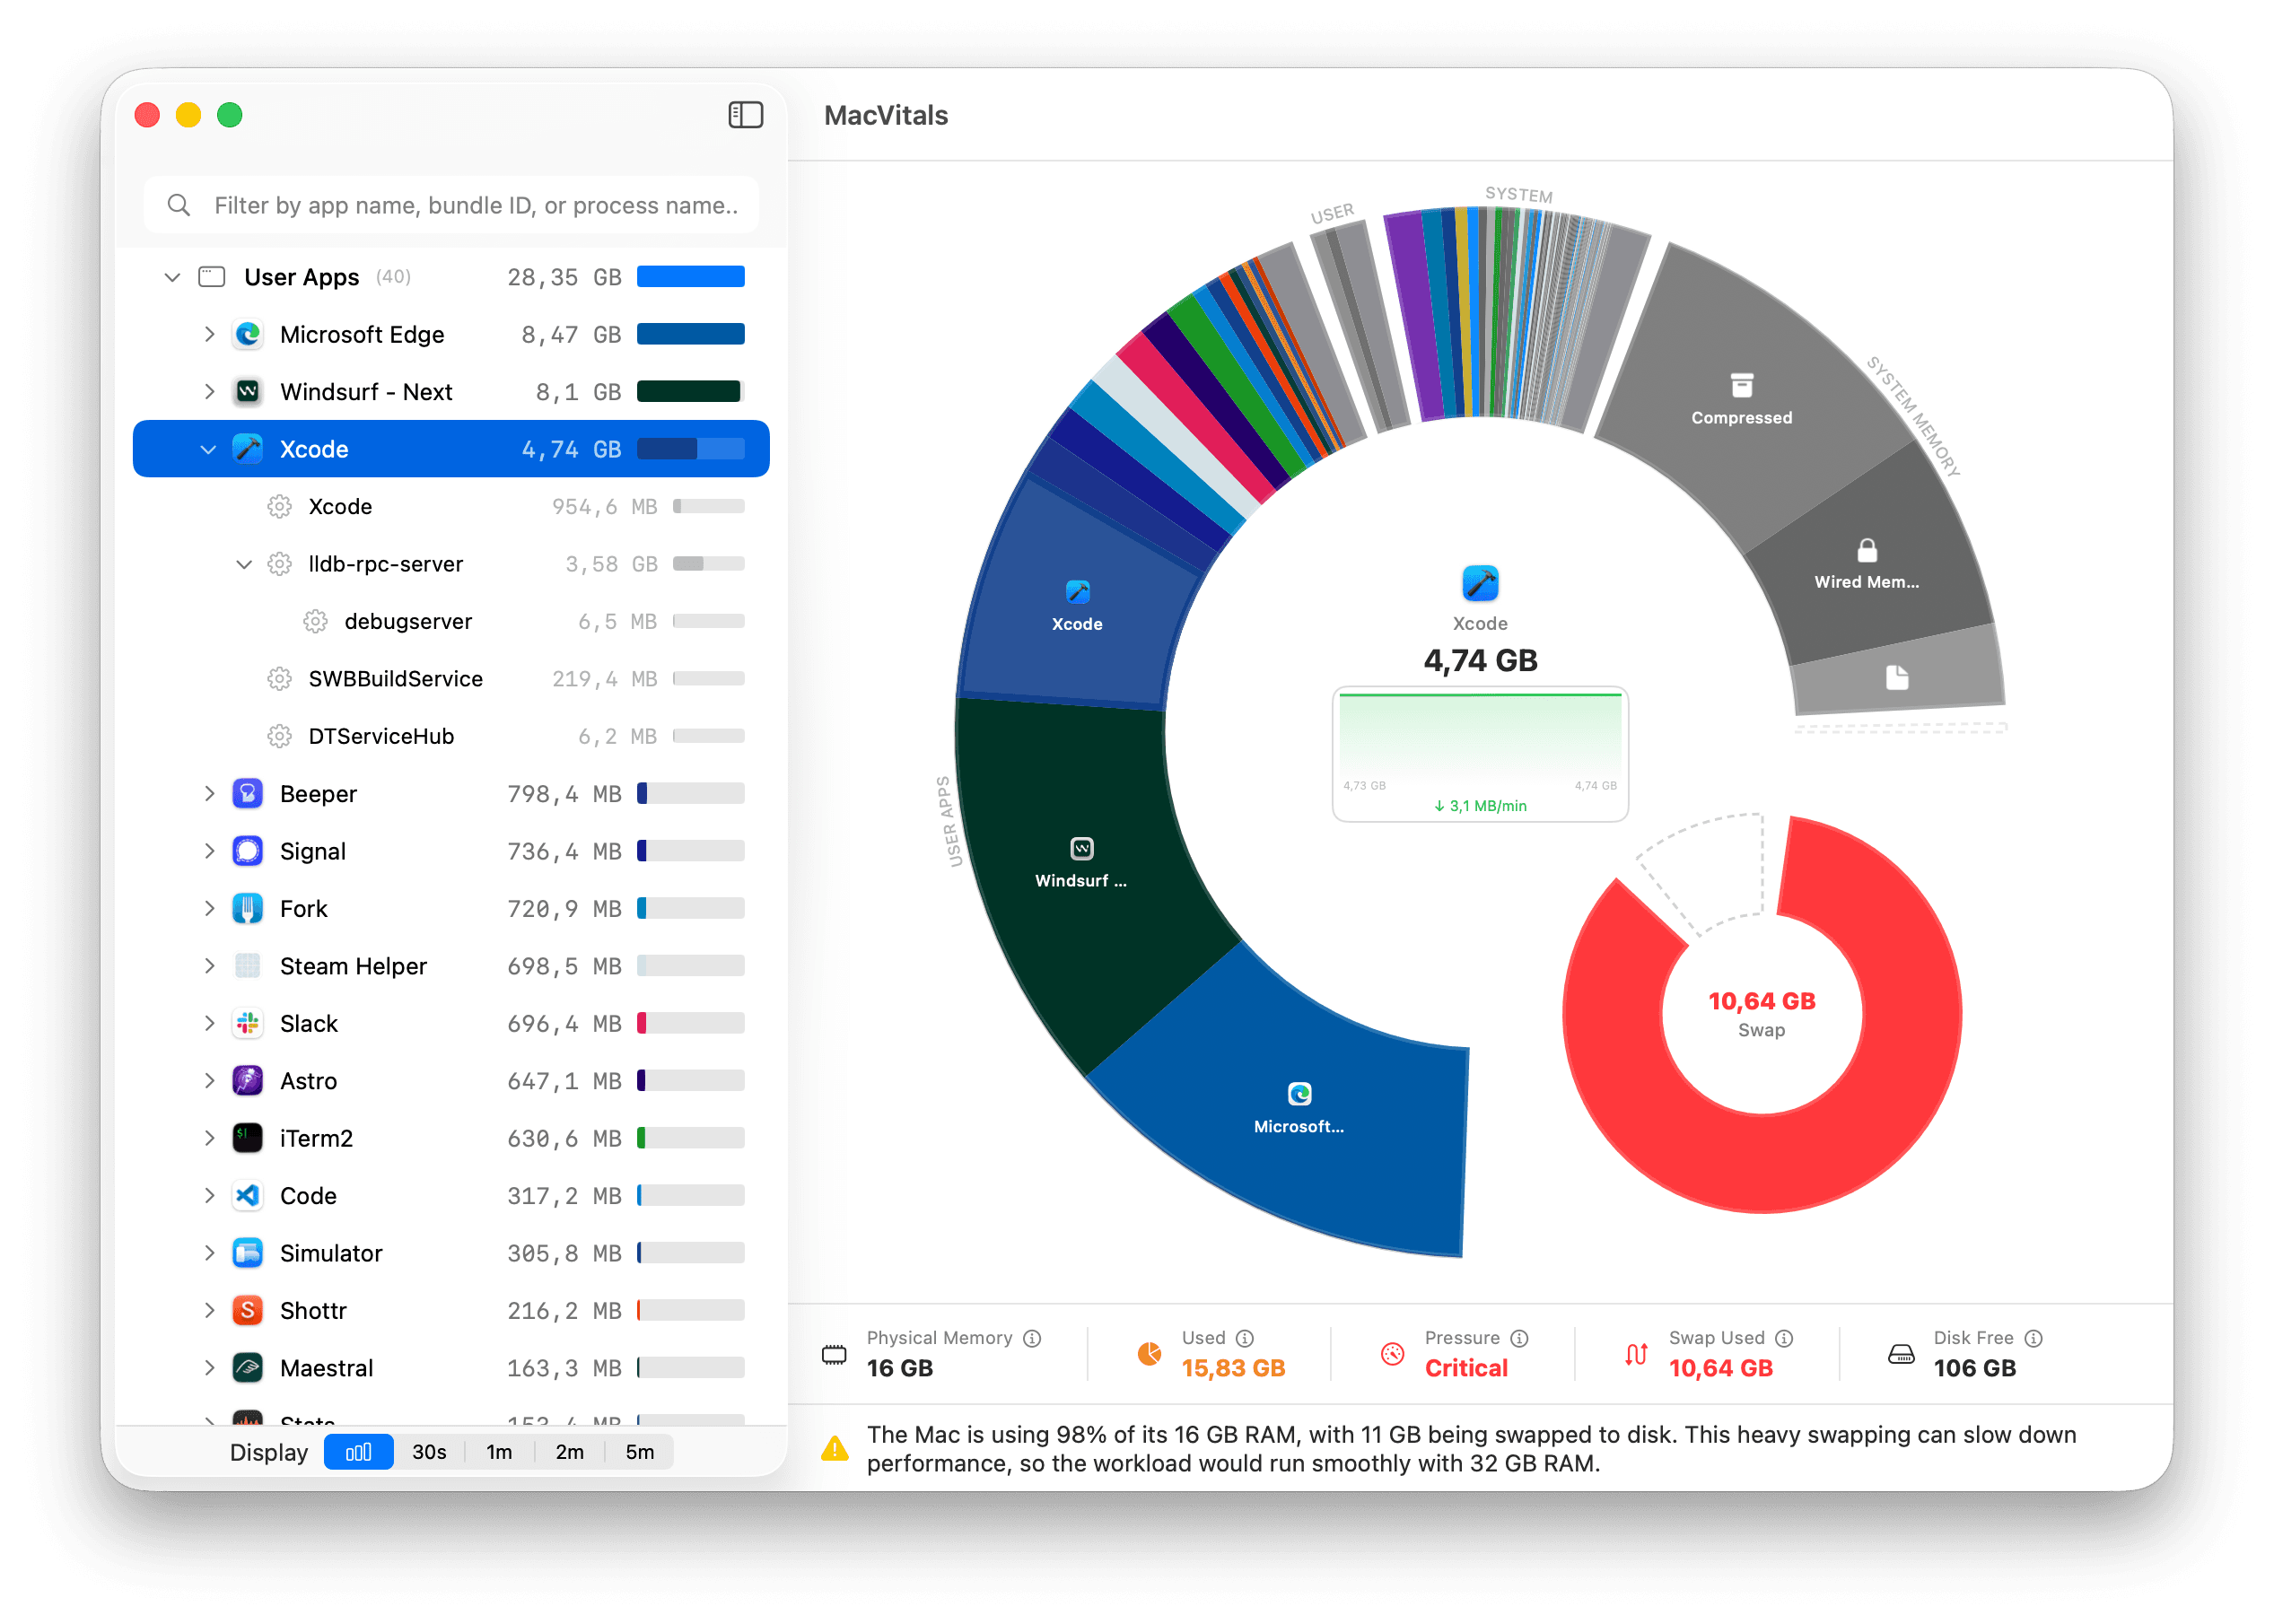
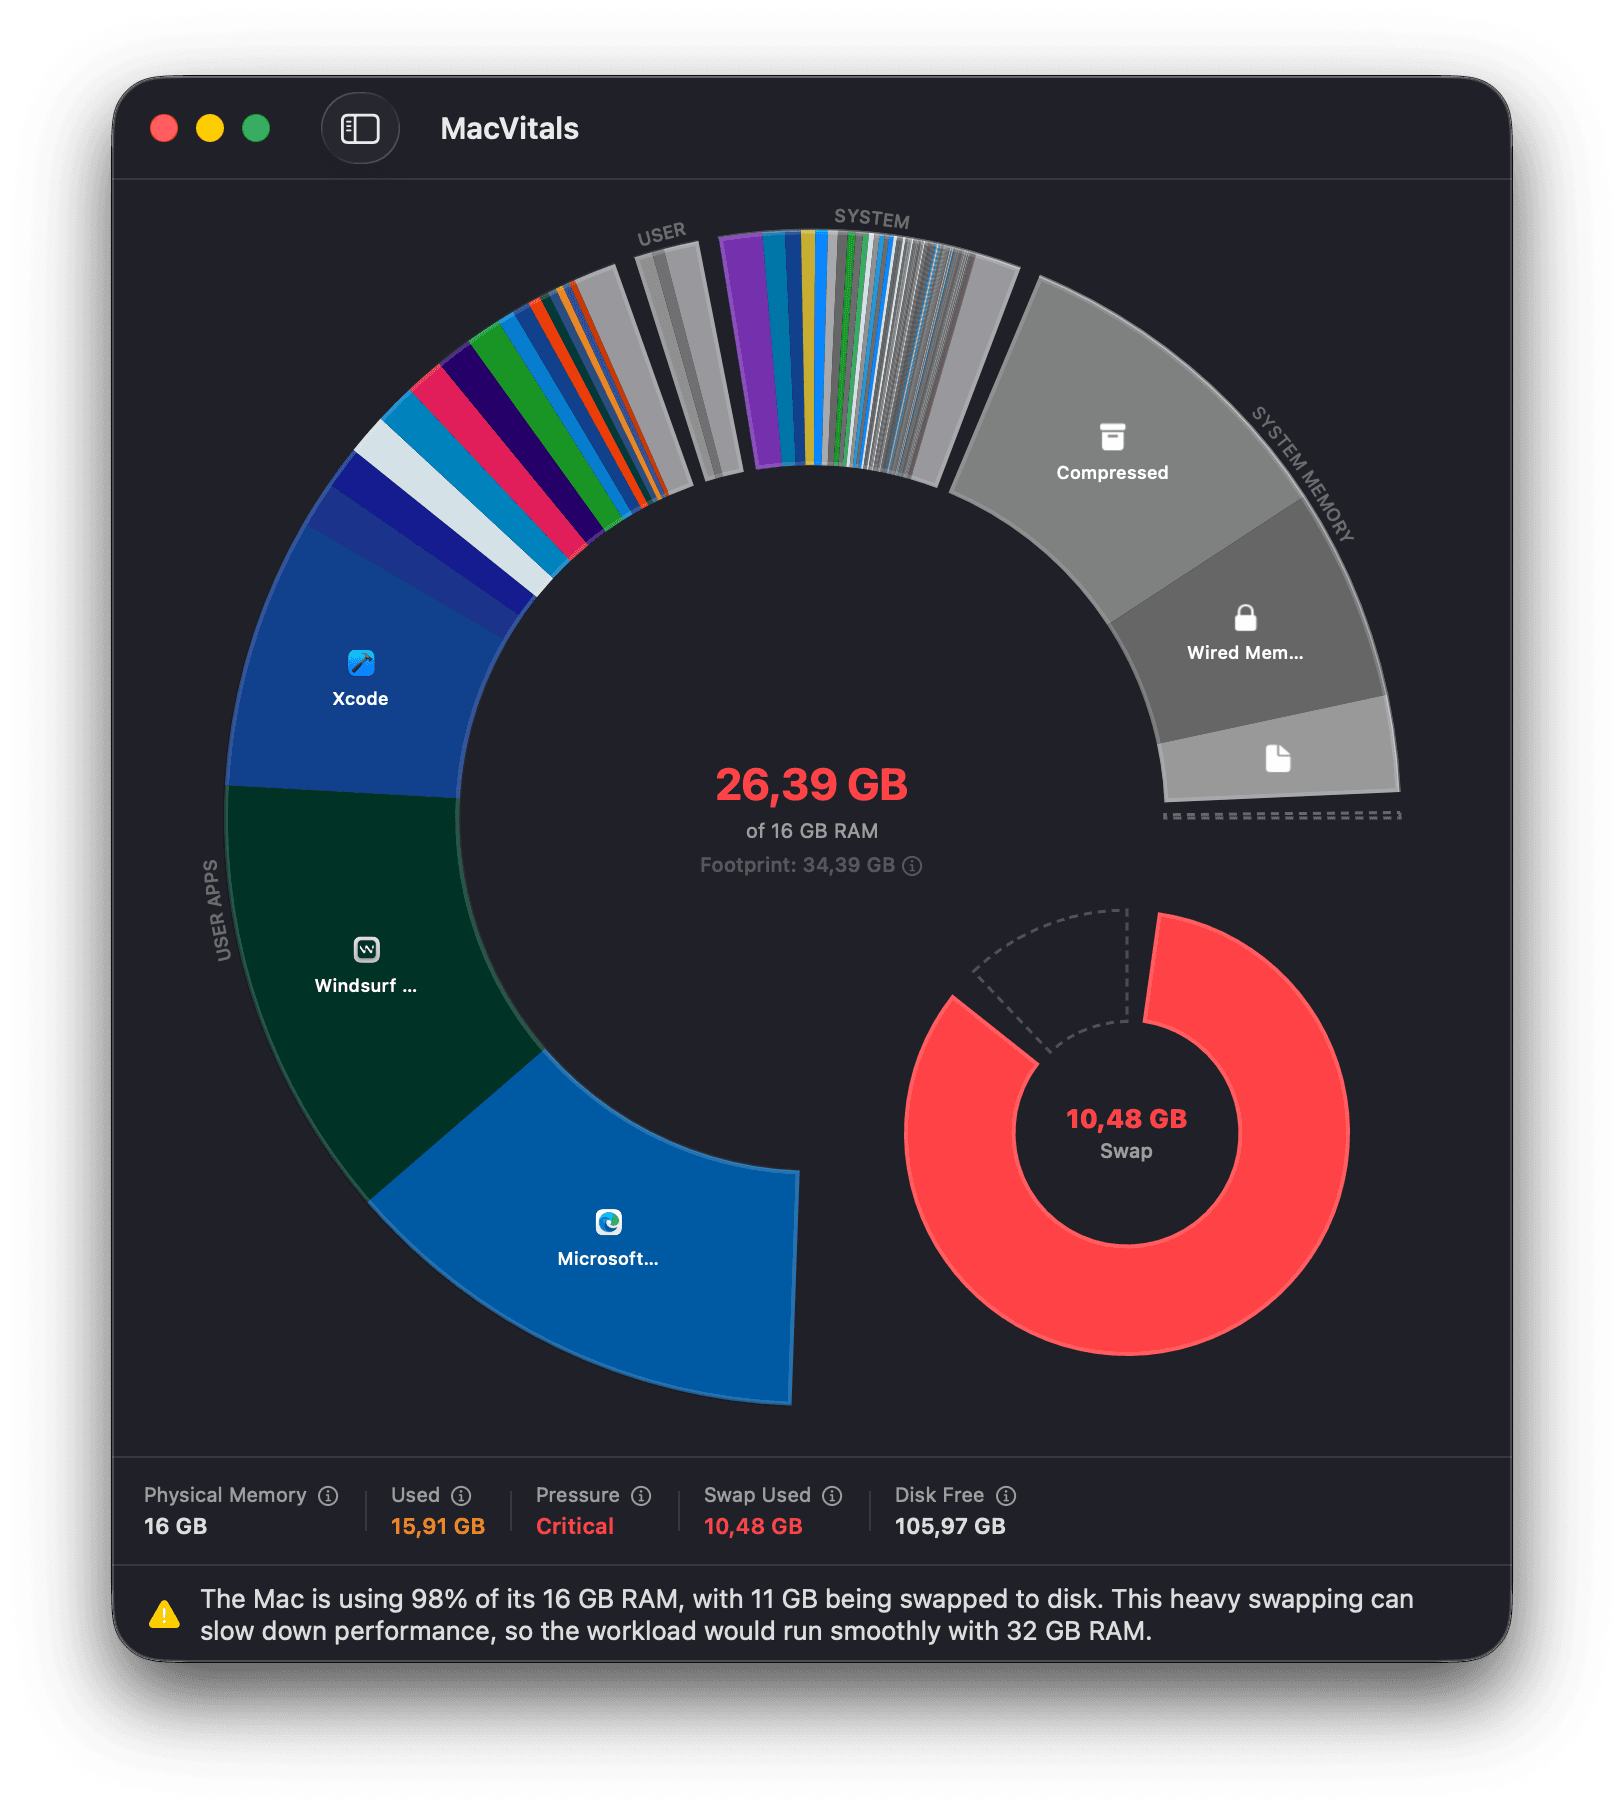
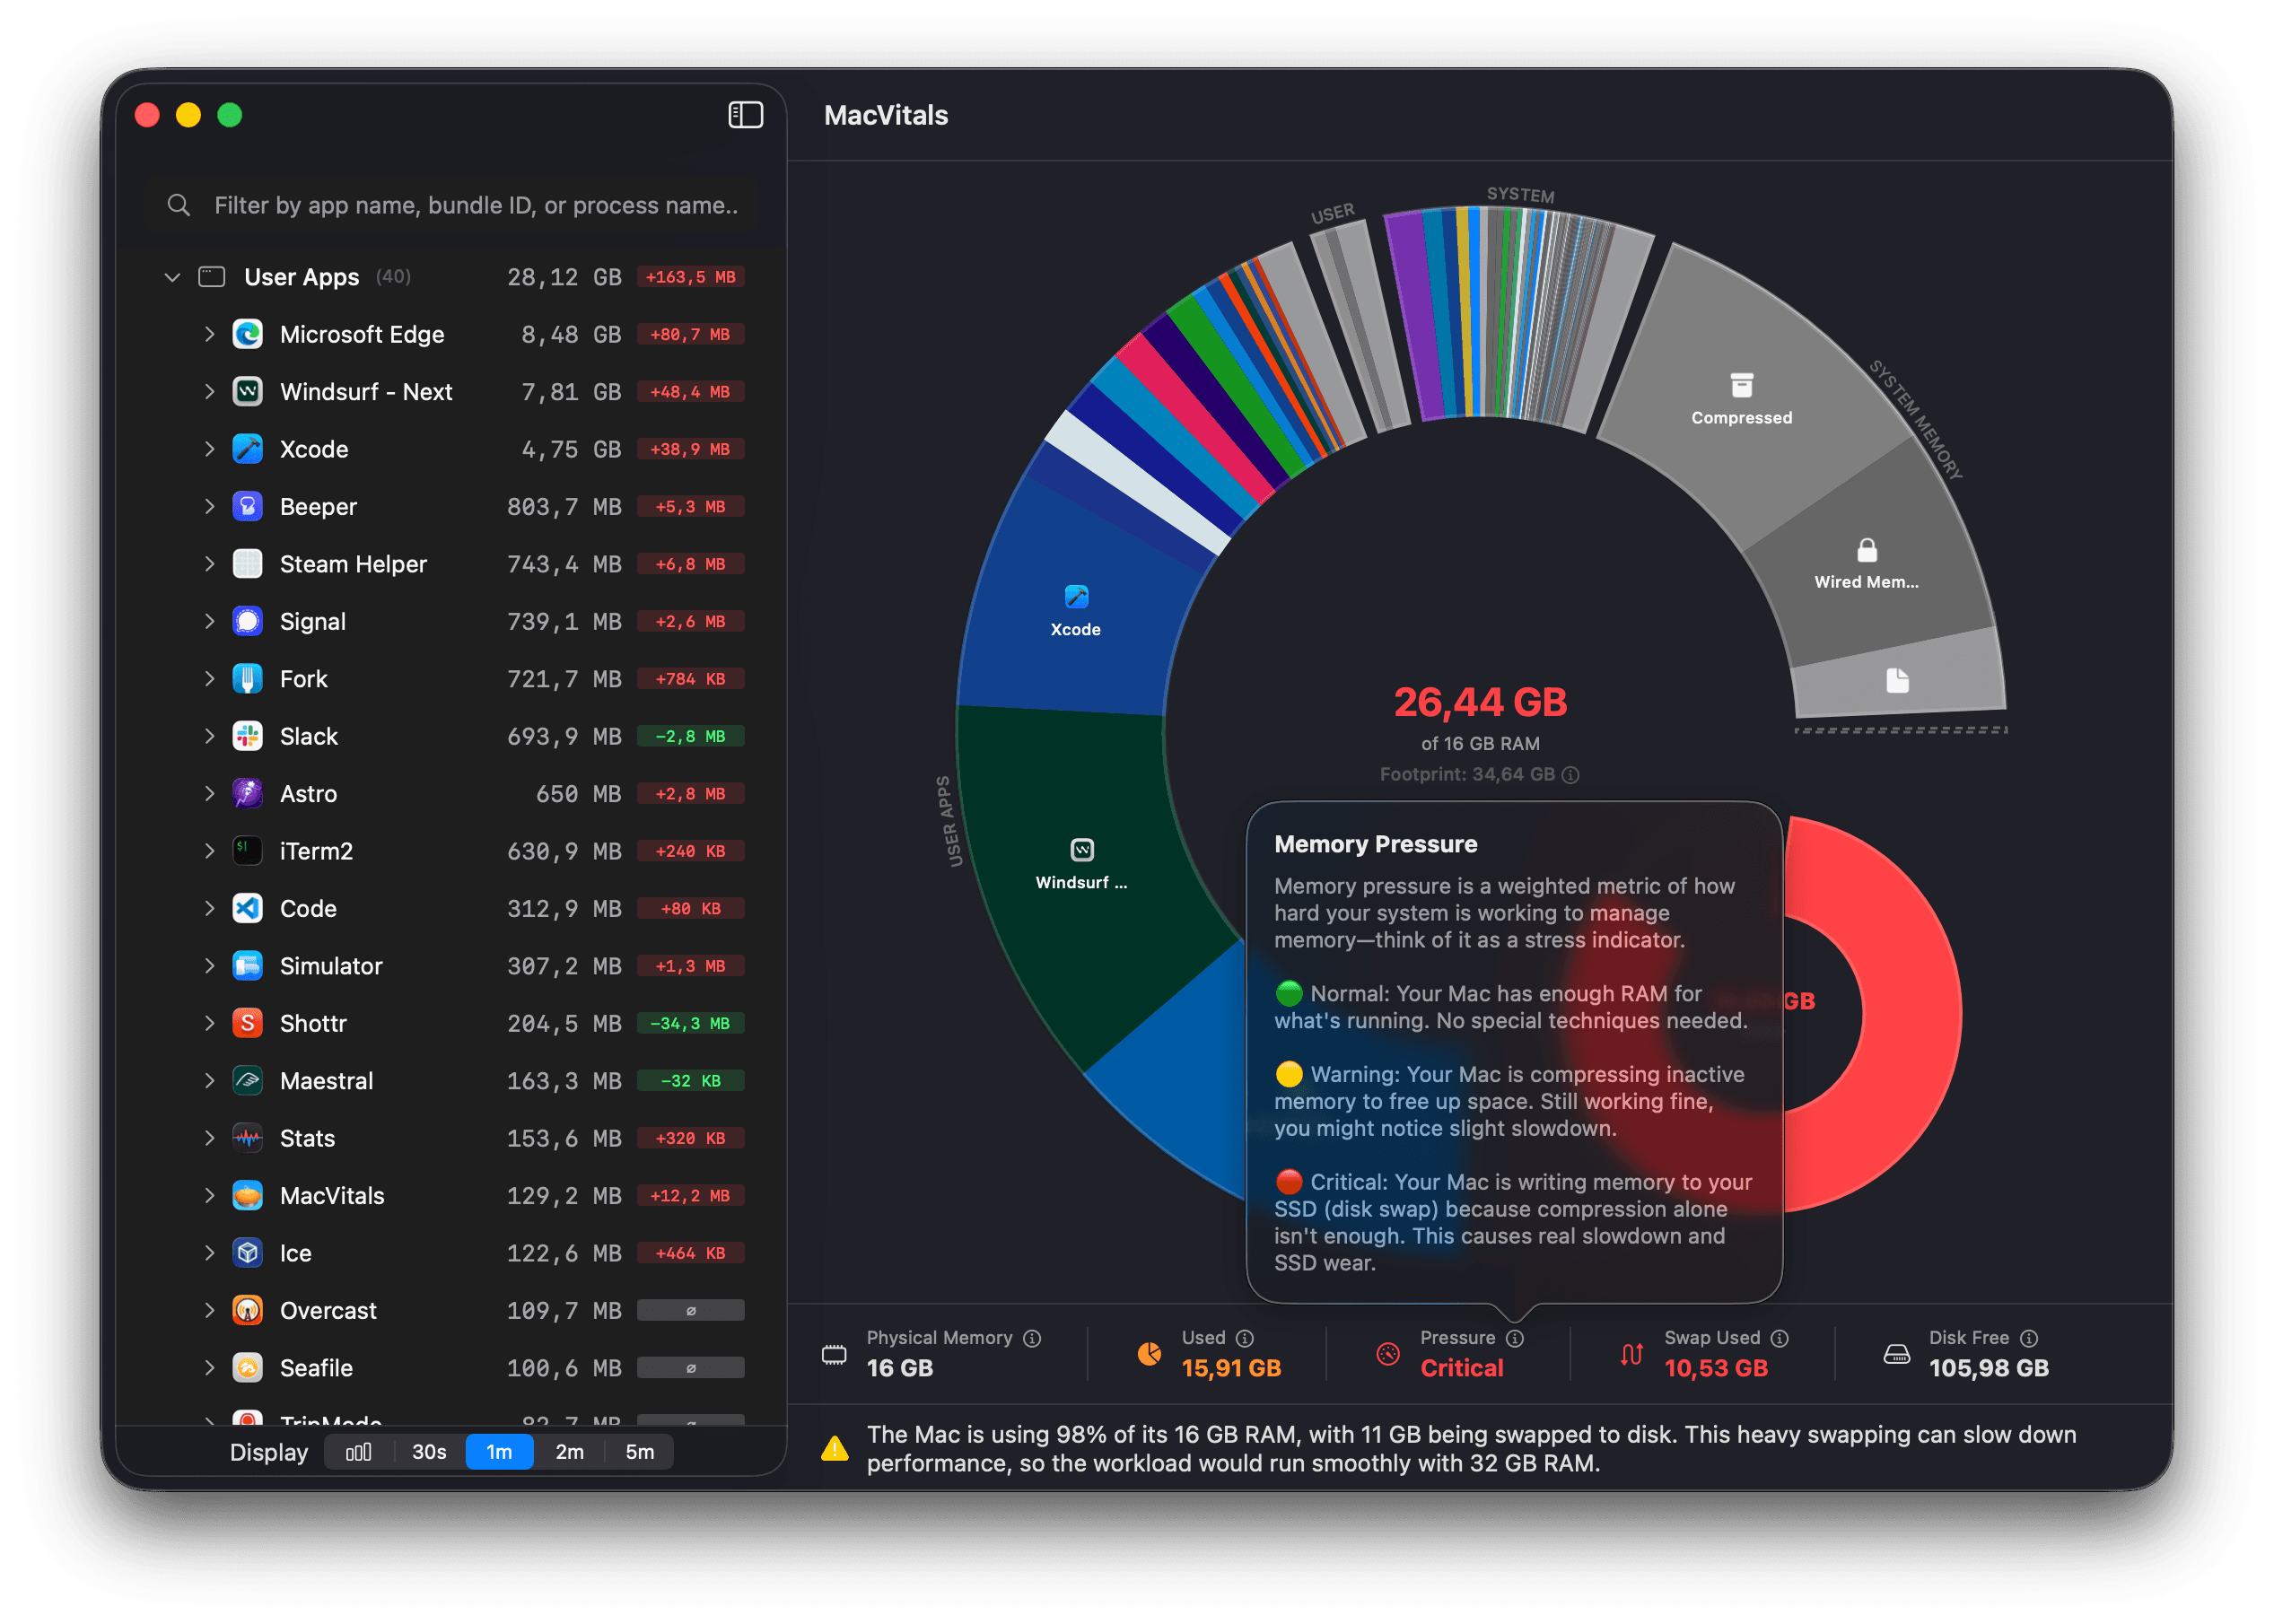
See total memory per app
Chrome runs 47 separate processes. Activity Monitor shows 47 rows. MacVitals shows one number: 4.2 GB.
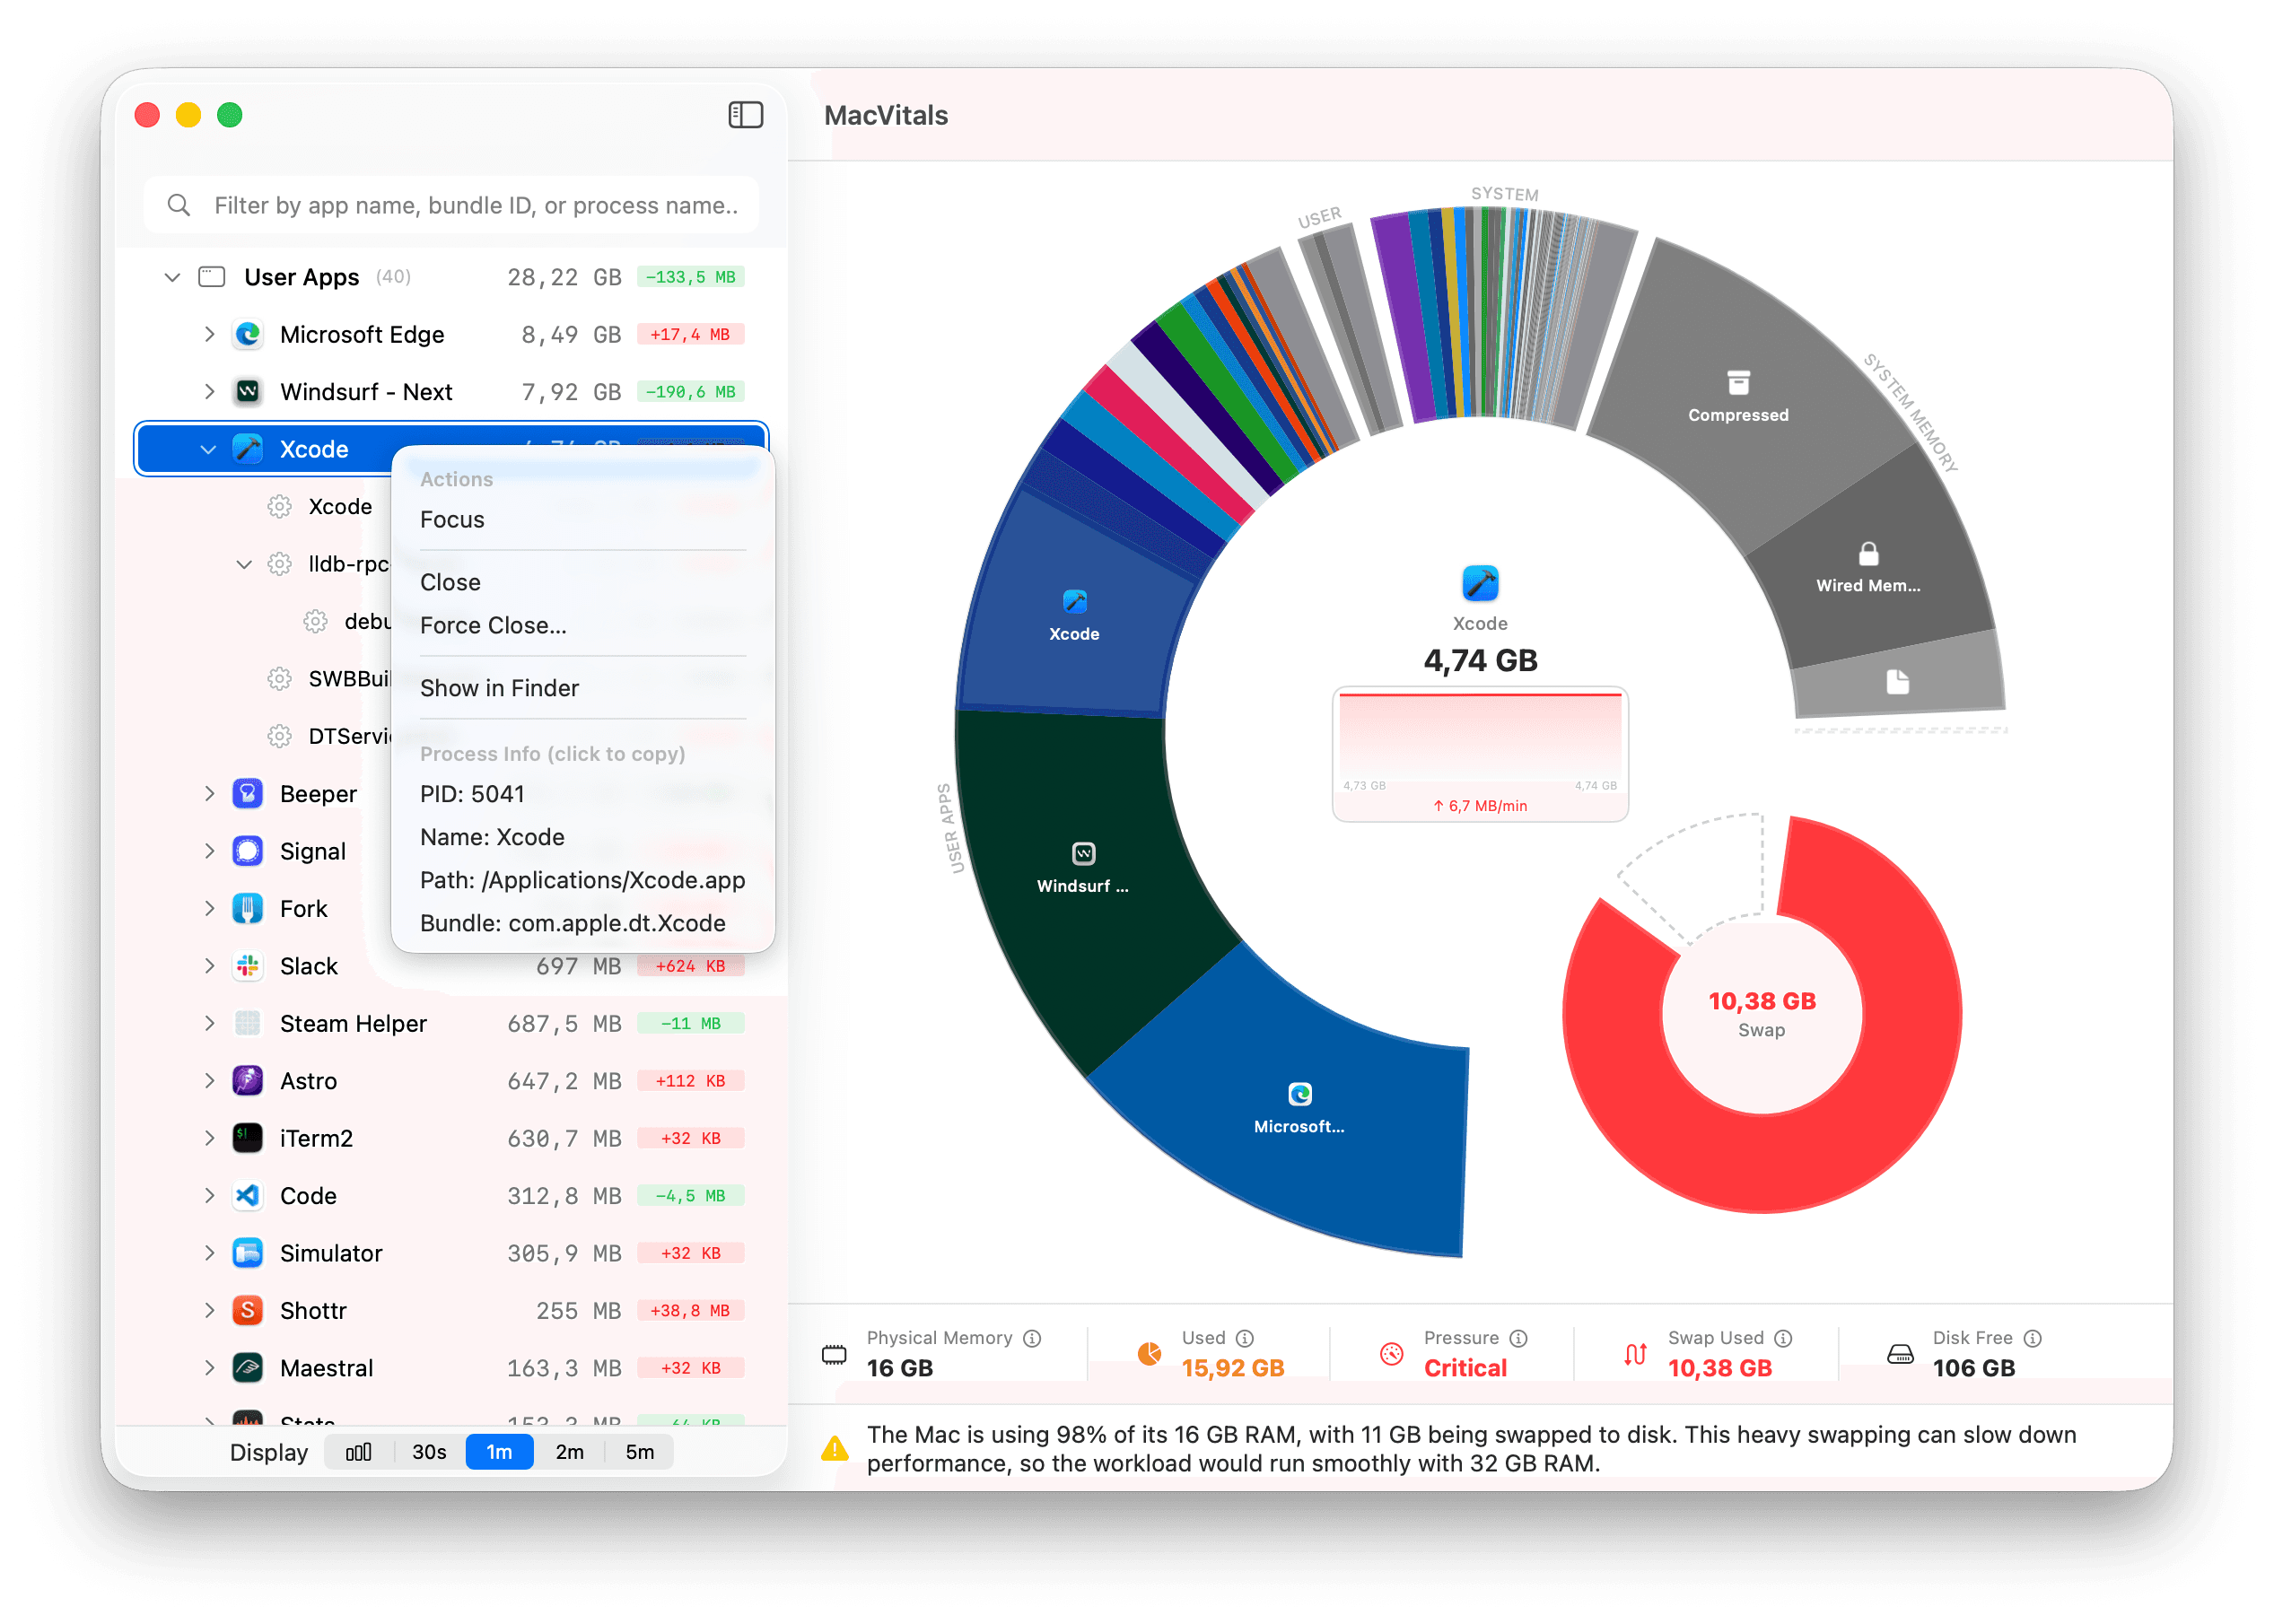
Spot runaway processes
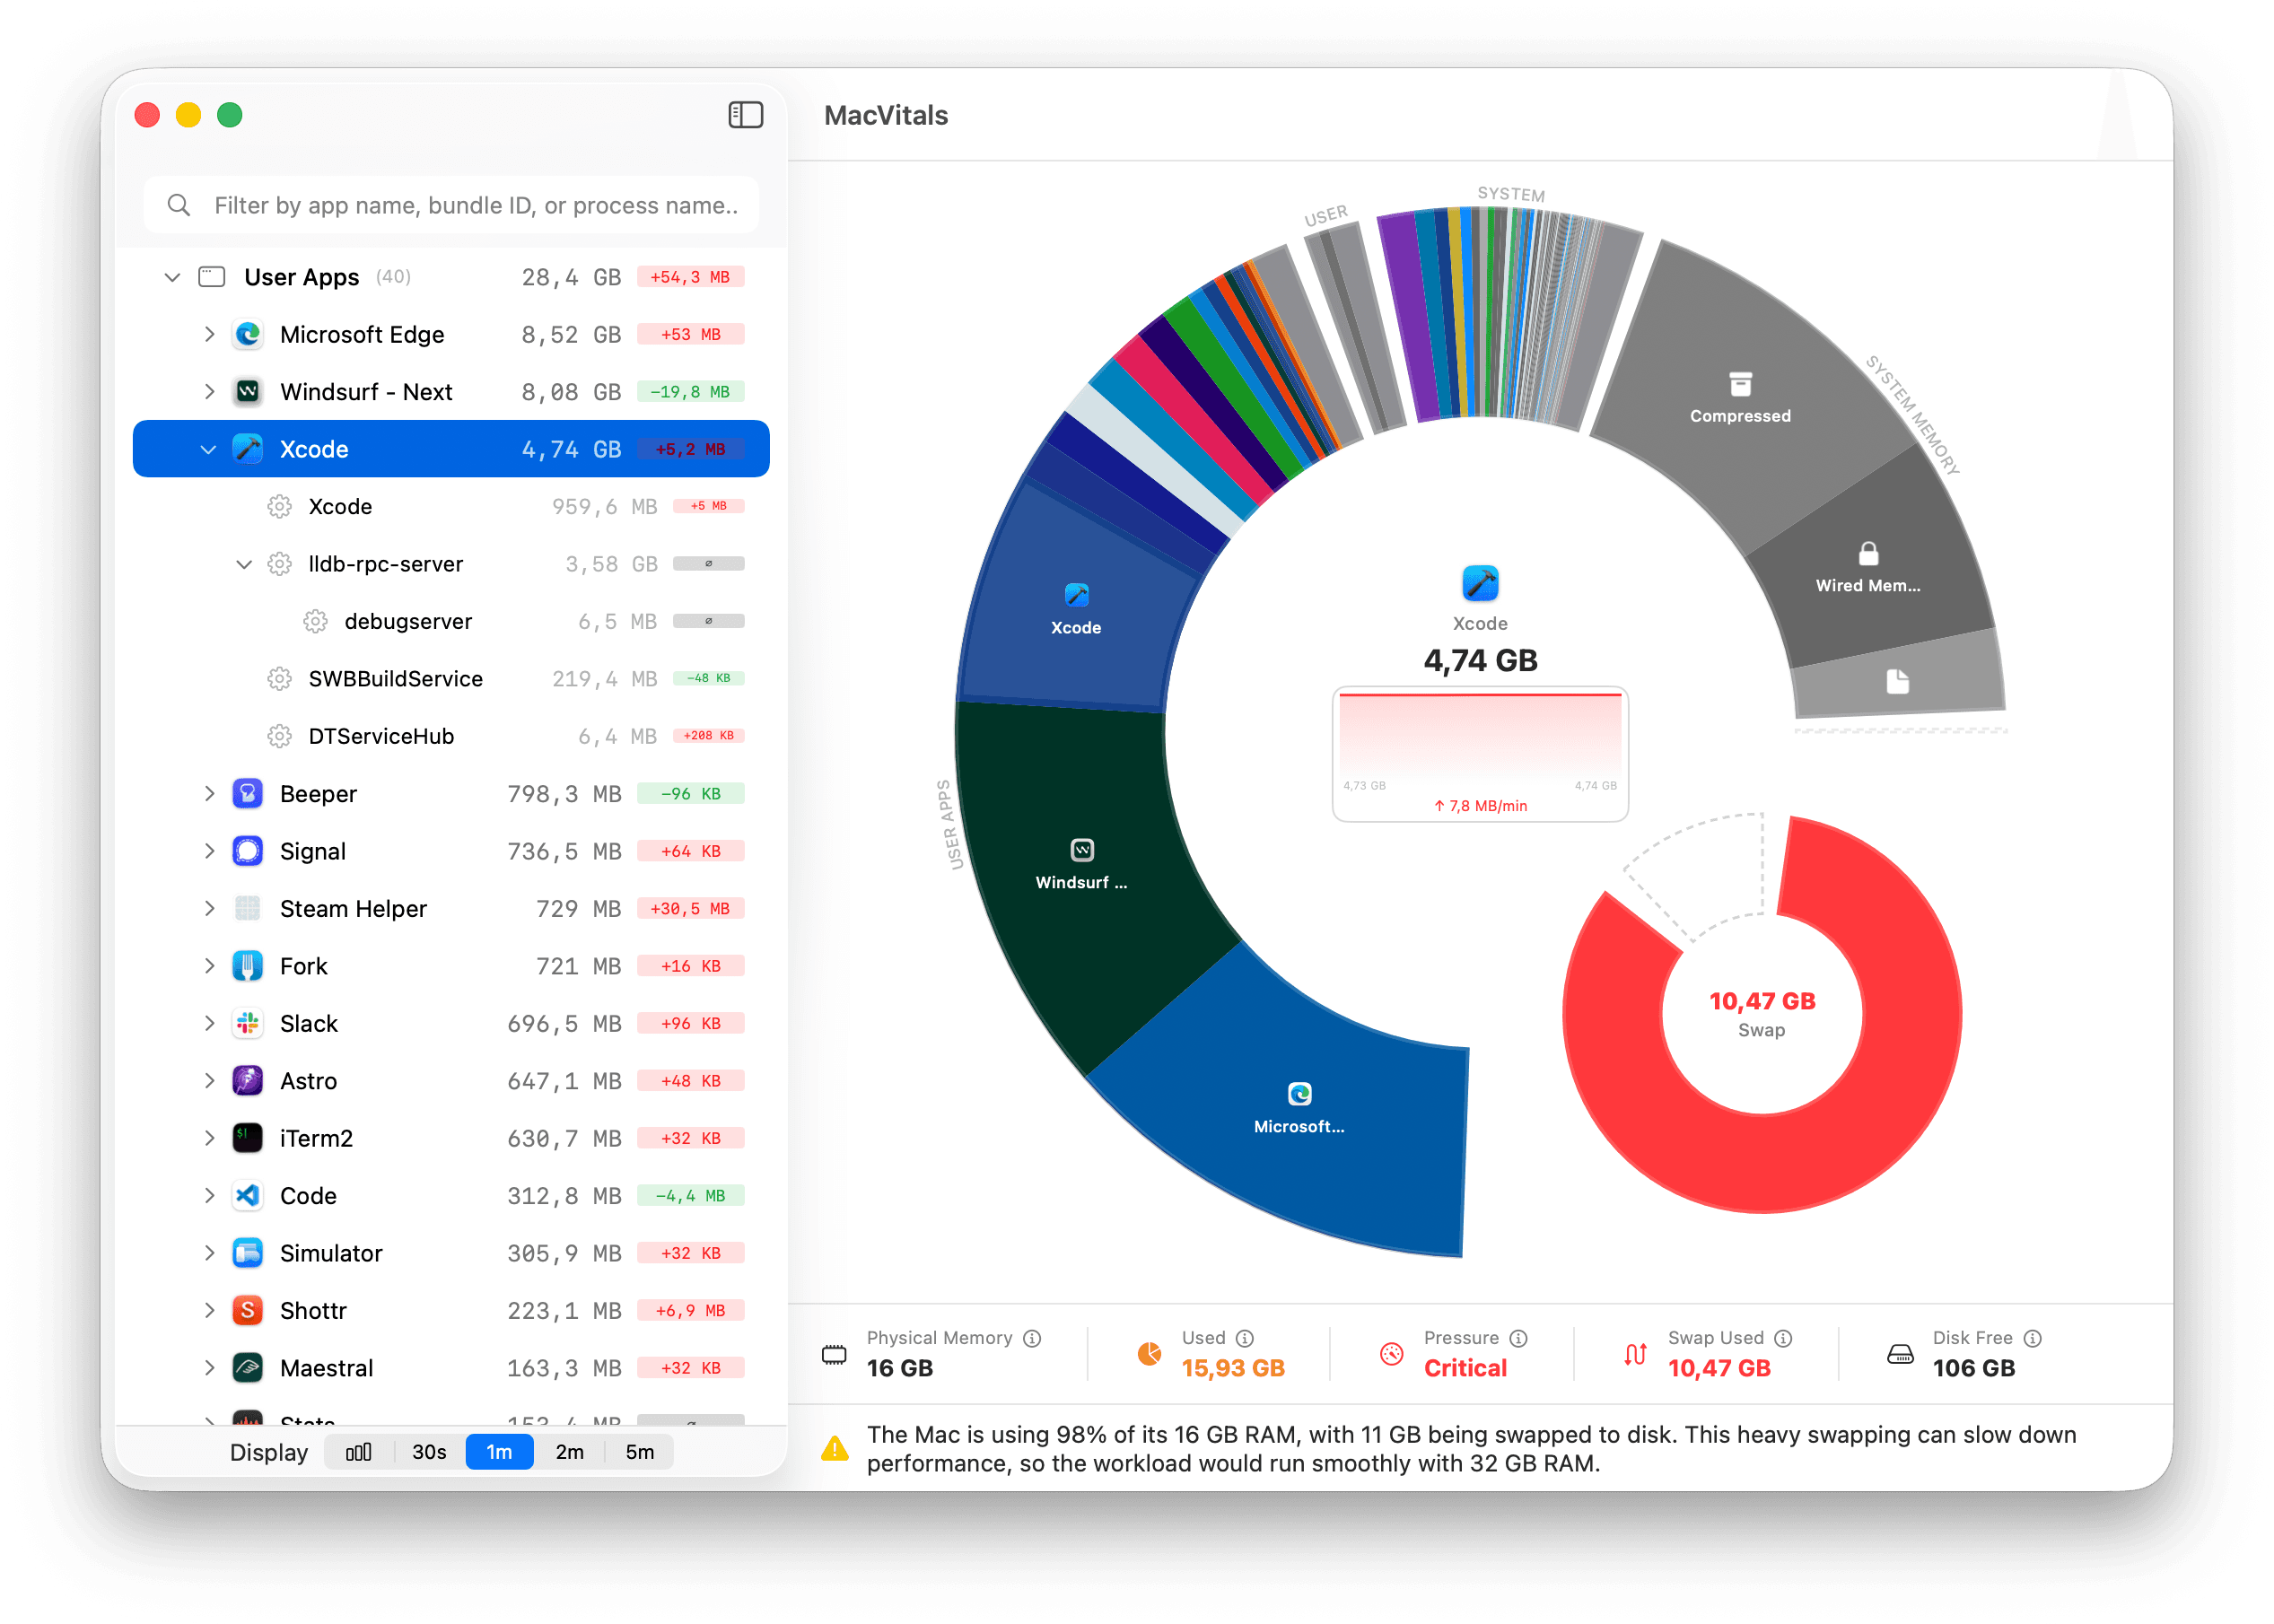
See if Xcode just jumped from 4 to 5 GB. Track memory trends over time and catch leaks before they slow you down.
Know how much RAM you need
MacVitals analyzes your actual usage patterns and tells you whether 16 GB is enough—or if your next Mac needs 32.
Why I built this
I'm an indie developer. While coding, I kept asking simple questions: how much memory is Xcode actually using? Is it climbing? What about all these background utilities?
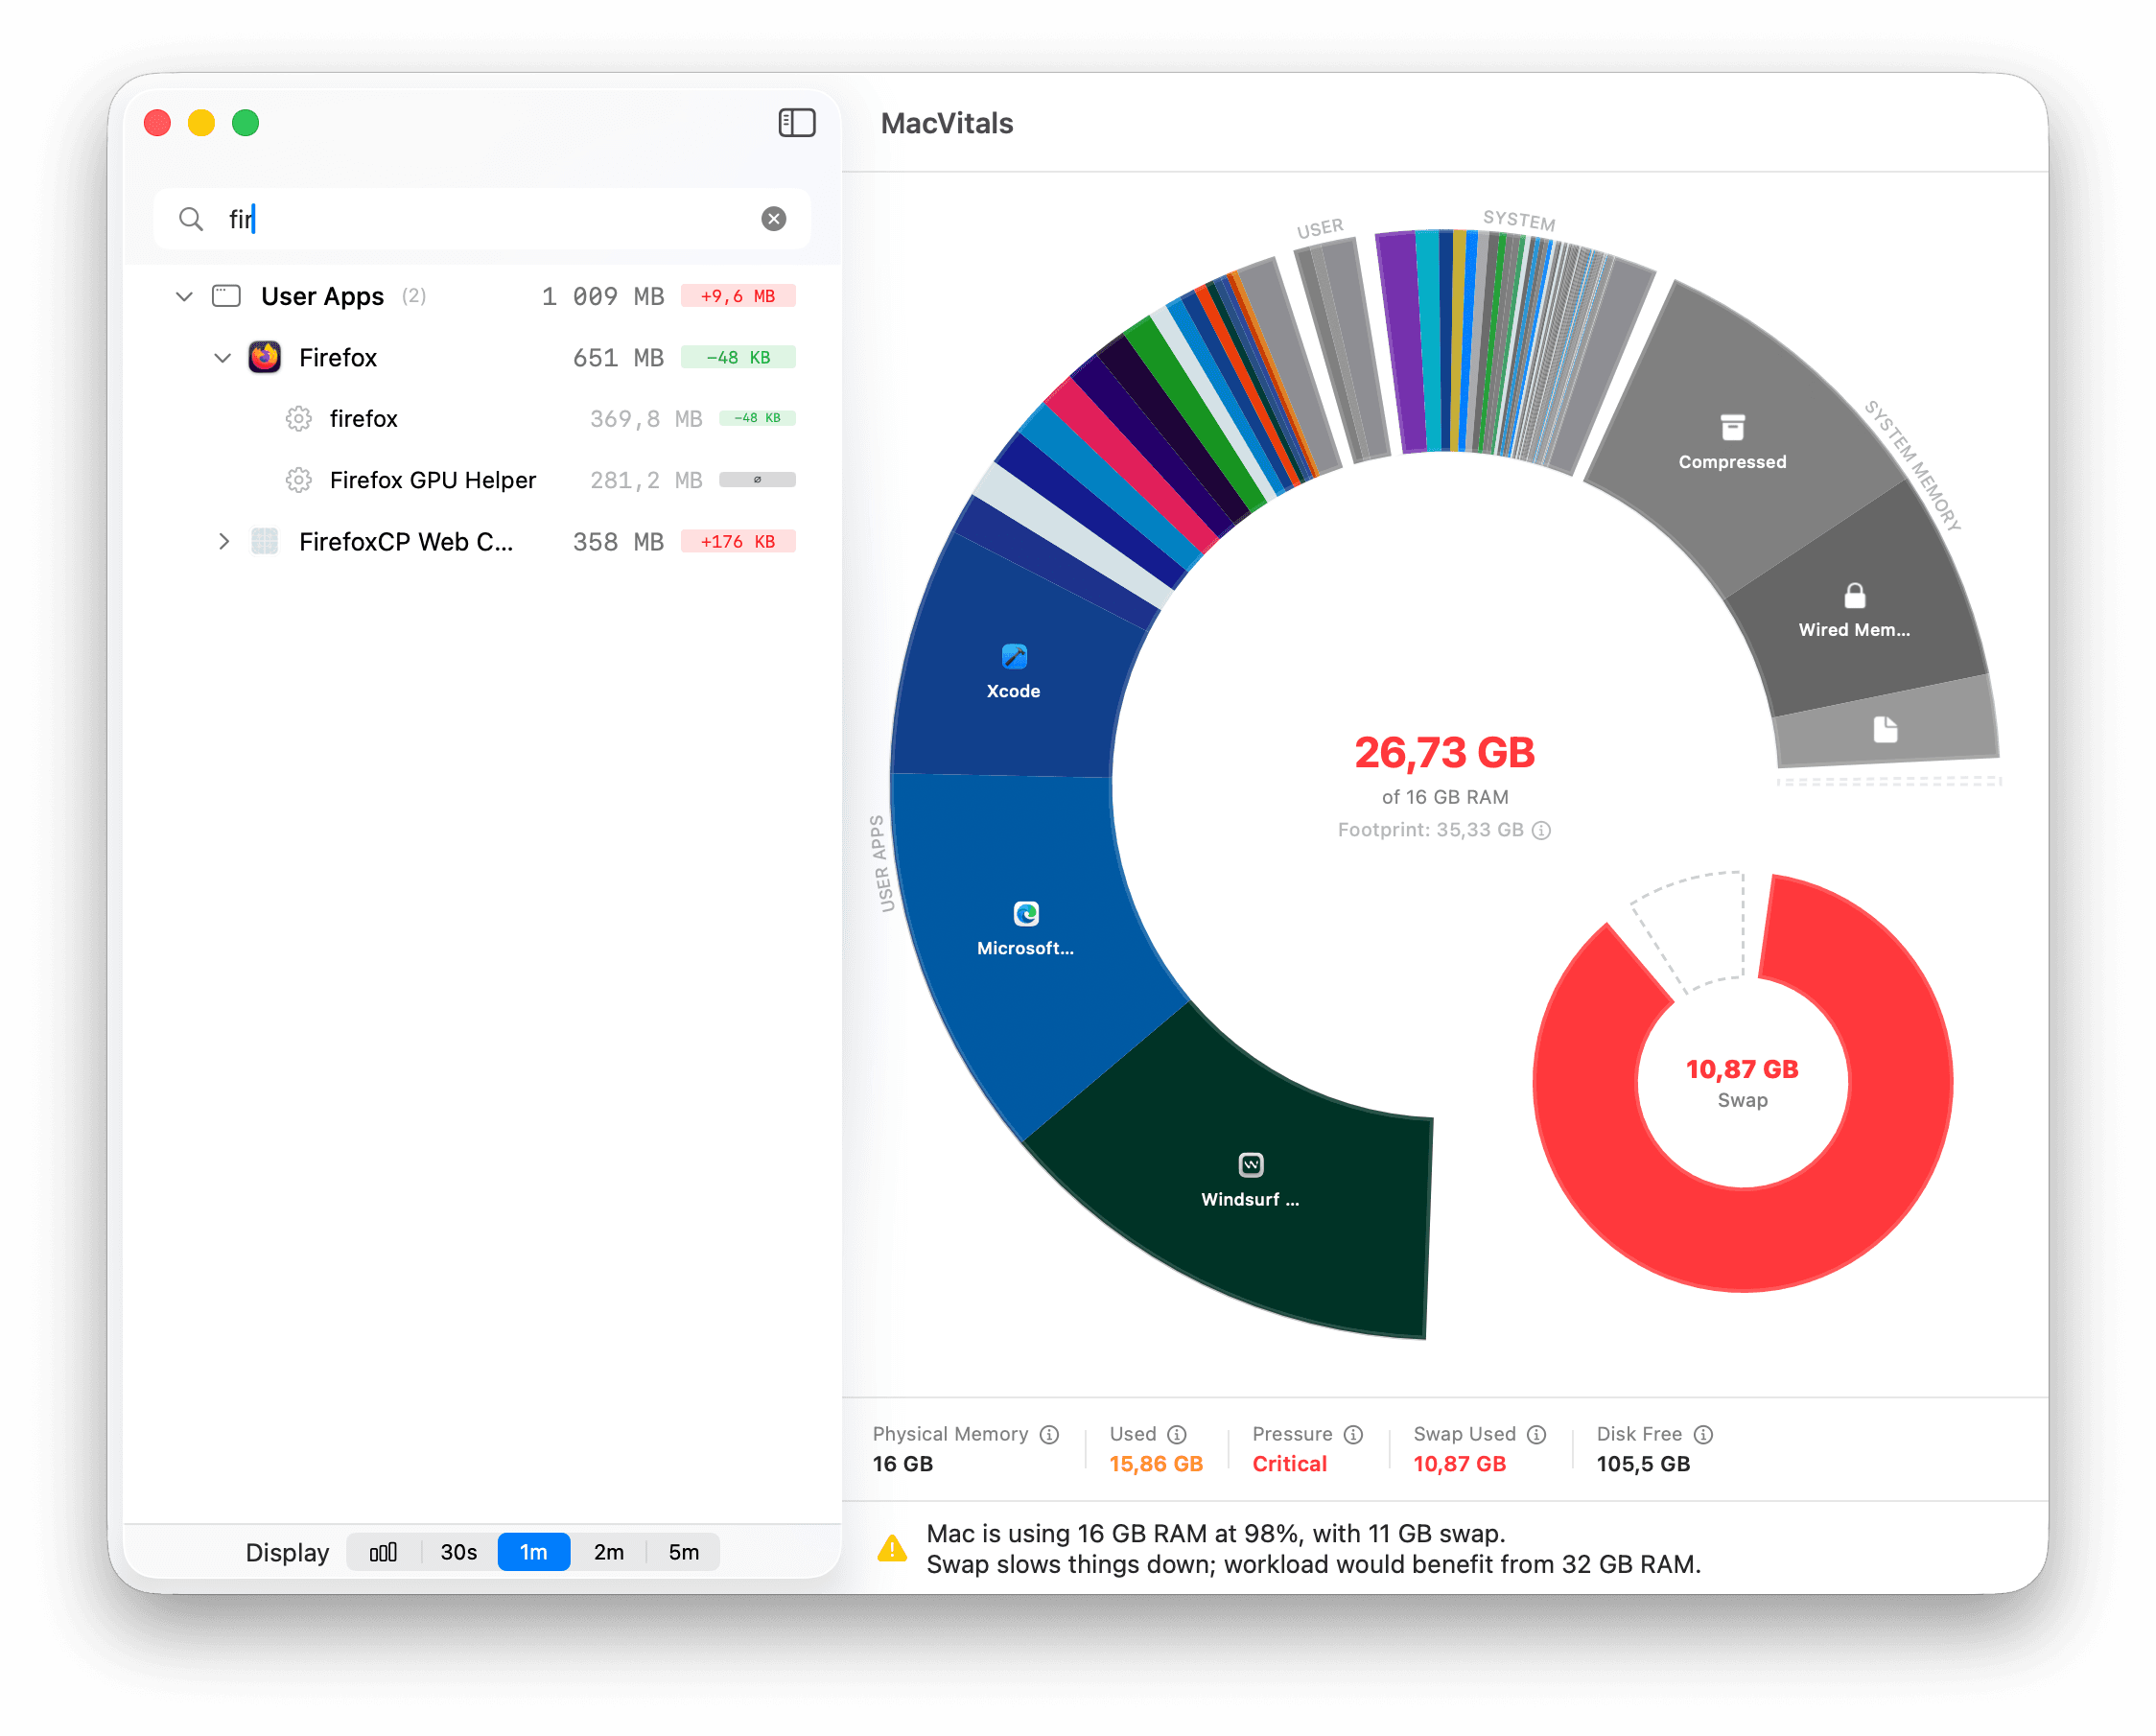
Activity Monitor couldn't help. It looks like Excel—hundreds of rows, no totals per app, no history. Chrome alone shows up as 47 separate processes. Good luck adding those up.
So I built MacVitals: one number per app, memory trends over time, and clear visualization of where your RAM is going. The kind of tool I always wanted.
I made it for myself, and now I'm sharing it with you. It's free.
— Tomas
From the same developer
Like beautifully visualized data?
I build apps with the same philosophy: rich charts, beautiful design, and information you can understand at a glance. If you like MacVitals, you might love Weathergraph—my weather app with the same attention to detail.
Check out Weathergraph →